« Data
Views »
VISUALIZATION
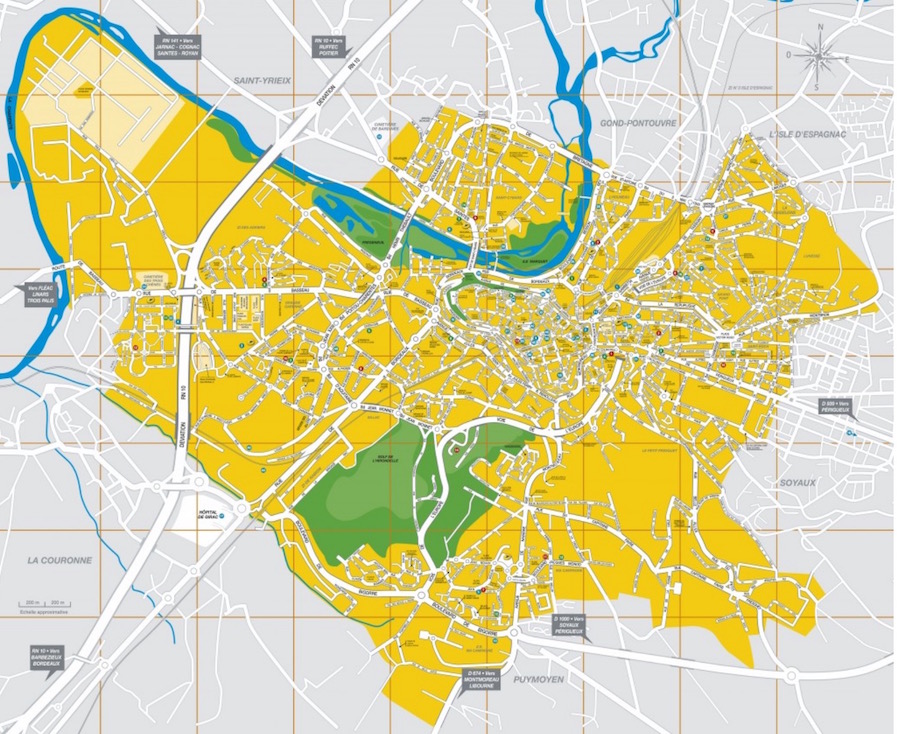
This visualization of Angoulême in 1791 and in 2017 was prepared by Scott Walker and Danielle Brown of the Harvard Map Collection, to whom the Visualizing Social Networks project are immensely grateful.